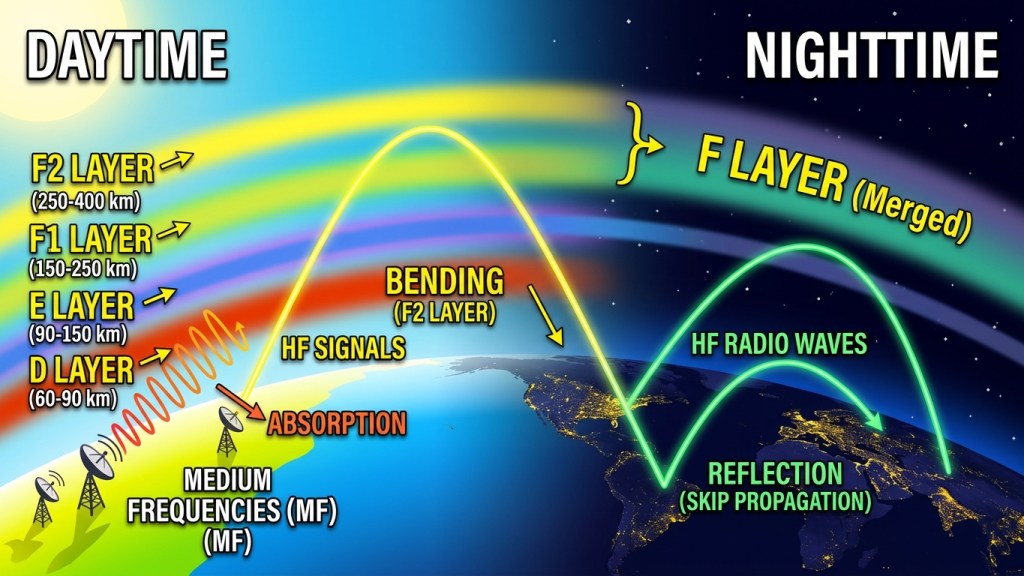
In late October 2026, many HF operators reported unusual or degraded conditions on the 20-meter band (around 14 MHz). Signals that are normally reliable for daytime DX felt attenuated or erratic on sunlit paths, with the impression that the ionosphere’s D-region was absorbing higher frequencies than usual. This is a classic signature of temporarily elevated electron density in the lower ionosphere, driven primarily by solar X-ray emission (and, to a lesser extent, geomagnetic influences).
https://www.youtube.com/live/pgTw9ZSIpXw
How the D-region works
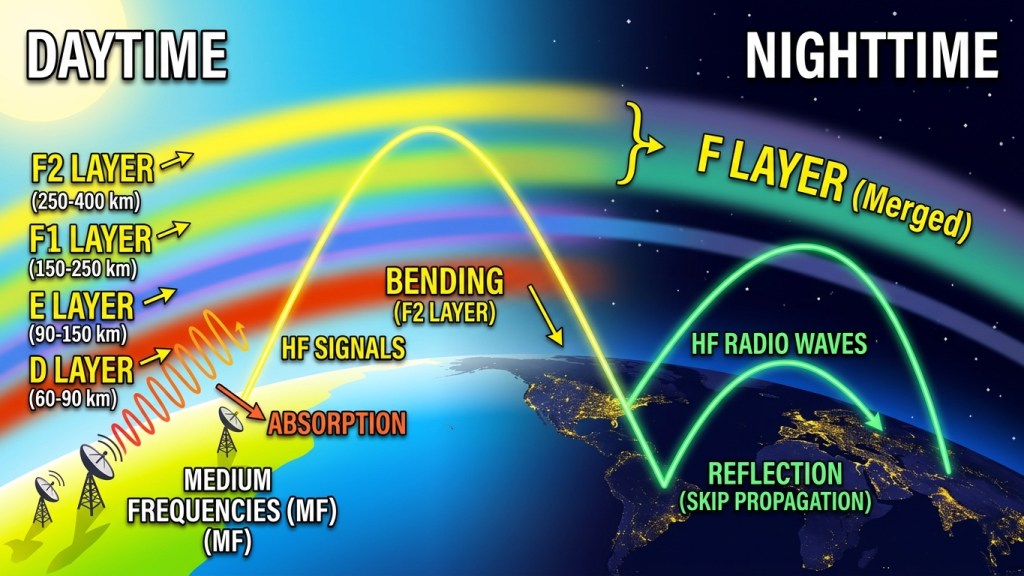
The D-region occupies roughly 50–90 km altitude. It is the lowest and densest part of the ionosphere. During daylight, solar ultraviolet and X-ray radiation ionize minor neutral constituents (especially nitric oxide via Lyman-alpha, and other species via harder X-rays). Free electrons collide frequently with the still-abundant neutral molecules at these altitudes. When an HF radio wave passes through this region on its way up to the reflecting F2 layer (near 250–400 km), the oscillating electric field of the wave accelerates those free electrons. The electrons then lose energy through collisions, converting electromagnetic energy into heat. The result is absorption.
Absorption is strongly frequency-dependent: it scales roughly as (or a similar power). Lower frequencies (80 m, 40 m) suffer heavy daytime attenuation; higher frequencies lose far less energy per unit path length. Under quiet solar conditions the highest frequency that experiences roughly 1 dB of vertical absorption (the “highest affected frequency,” or HAF) stays well below 14 MHz over most of the Earth. Twenty meters therefore usually punches through the D-region with only modest loss and reflects from the F2 layer, supporting reliable daytime and gray-line paths.
When the electron density in the D-region rises sharply, the HAF climbs. NOAA’s D-Region Absorption Prediction (D-RAP) model relates soft X-ray flux (0.1–0.8 nm) measured by GOES satellites to the HAF at the sub-solar point with an empirical relation of the form.
(with a solar-zenith-angle correction that reduces the effect away from the sub-solar point and drops it to zero on the night side).
Rough benchmarks are:
- M1-class flare → HAF ≈ 15 MHz
- M5-class flare → HAF ≈ 20 MHz
- X1-class flare → HAF ≈ 25 MHz
Frequencies below the local HAF experience rapidly increasing attenuation. Even a modest M-class event can therefore begin to erode 20-meter signals on the sunlit hemisphere, especially on multi-hop or low-elevation paths that traverse a longer slant range through the D-region. Recovery typically occurs within tens of minutes to an hour after the flare peak, once the excess ionization recombines.
Solar energetic particles (protons) produce a related but geographically different effect—polar-cap absorption—primarily at high latitudes. Elevated geomagnetic activity can also increase particle precipitation and modestly raise D-region densities, particularly in the auroral zones.
What I understand happened in October 2026
October 2026 opened with relatively high solar activity. The 10.7 cm solar flux index (SFI) sat in the 120–137 range early in the month, with multiple sunspot regions producing C-class and several M-class flares. Notable events included an M6.7 (R2) flare on 8 October and an M6.4 (R2) flare on 10 October, both capable of pushing the HAF well into or above the 20-meter band on the dayside for tens of minutes. These produced short-wave fadeouts that operators on the sunlit side of Earth would have noticed as sudden drops in signal strength across the HF bands, including 20 m.
Activity then declined. An M1.6 (R1) flare occurred on 19 October from Region 4551—the largest of that week. This was still sufficient to raise the HAF to approximately 15 MHz at the sub-solar point, producing minor degradation of lower HF and noticeable attenuation on some 20-meter paths. Concurrently, a positive-polarity coronal-hole high-speed stream arrived, driving G1 (minor) geomagnetic storming on 21 October and unsettled-to-active conditions on 22–23 October. High-latitude paths experienced additional absorption and F-region depression.
By the final week of October the SFI had fallen to the high-80s to low-90s, sunspot numbers were low (around 12–25), and X-ray background levels were only B-class. No significant radio-blackout events occurred in the 24–30 October window, and geomagnetic conditions were mostly quiet until a new coronal-hole high-speed stream began to influence Earth late on the 30th (with G1 possible on 31 October–1 November). Under these low-flux conditions the maximum usable frequency (MUF) on many mid-latitude paths sits closer to or only modestly above 14 MHz.
Even the normal daytime D-region absorption—which is always present—removes a larger fraction of the available signal margin. Paths that previously worked comfortably now feel “absorbed” or marginal. Multi-hop routes and those near the terminator are especially sensitive. Operators therefore correctly perceived that the D-region was affecting higher frequencies more than they expected under “normal” recent conditions.
Practical implications and monitoring
The combination of residual flare effects earlier in the month, the declining solar cycle phase, and the approach of another high-speed stream produced the “weird” 20-meter week. When the SFI is high and the D-region is quiet, 14 MHz has substantial headroom above both the absorption cutoff and the MUF. When the SFI drops and any extra ionization appears, that headroom shrinks and absorption becomes the limiting factor.
Operators can monitor real-time conditions via NOAA SWPC’s D-RAP maps (global 1 dB and frequency-specific absorption charts), GOES X-ray flux plots, and the planetary K-index. Digital-mode reports and reverse-beacon networks also give rapid empirical feedback. During elevated X-ray flux the safest strategy is usually to move higher in frequency if the MUF supports it, wait for the recovery clock shown on D-RAP, or shift to gray-line or night-time paths where the D-region has largely recombined.
In short, the D-region did exactly what physics predicts: when solar X-rays (and secondarily geomagnetic activity) raised its electron density, absorption extended to higher frequencies than the quiet-day baseline. Combined with a falling solar flux that lowered the MUF, the result was a noticeable degradation of the usually dependable 20-meter band in late October 2026.


Leave a Reply